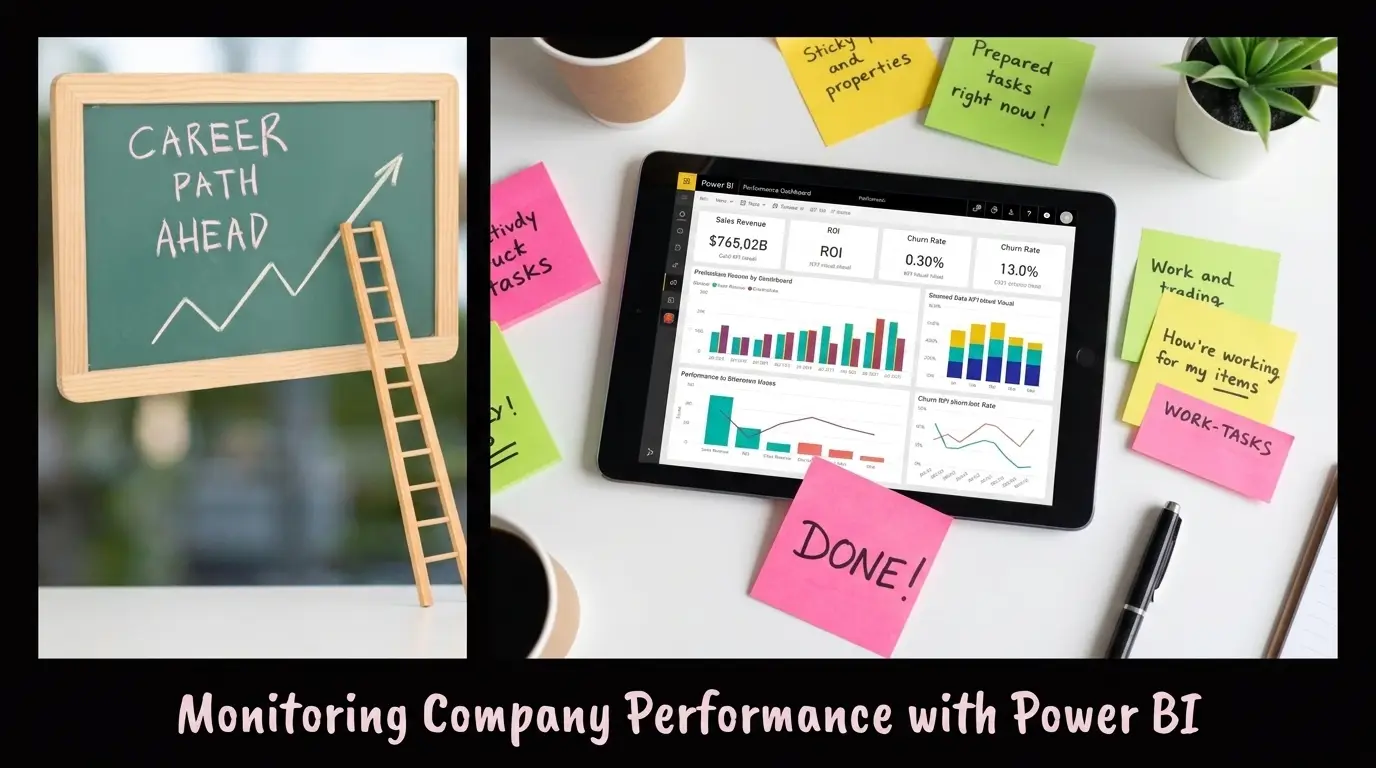
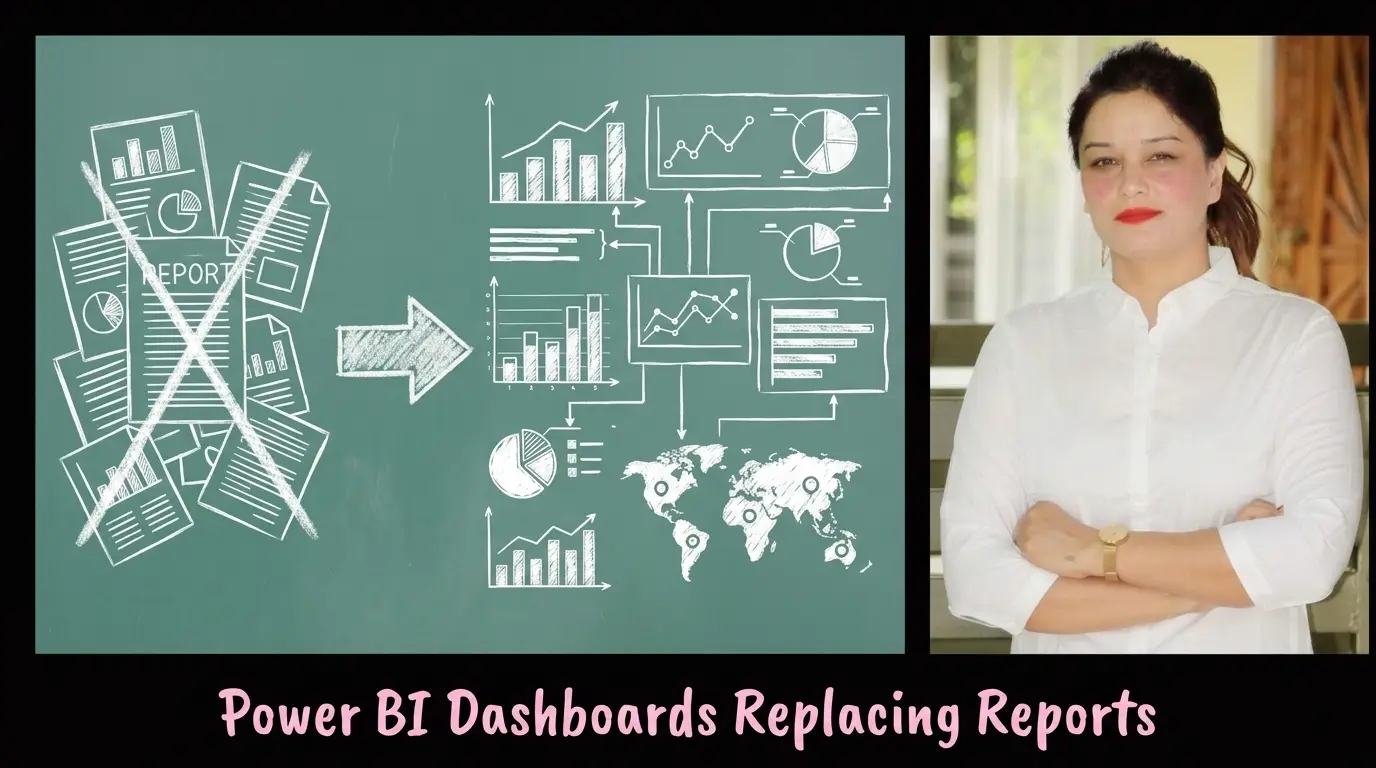

A single Power BI dashboard can replace multiple spreadsheets and reports by bringing all critical business data into one interactive view. Using Microsoft Power BI Business Intelligence, organizations can build a comprehensive Business Performance Dashboard that improves decision-making, saves time, and provides real-time business insights. Learning these skills through the best Power BI courses online helps professionals create powerful dashboards that drive business success.
Many organizations still rely on multiple Excel reports to monitor business performance.
The finance team prepares one report.
Sales creates another.
Operations maintains separate spreadsheets.
HR tracks employee performance in different systems.
Senior management then spends hours reviewing multiple reports before making important business decisions.
This process is time-consuming, inefficient, and often leads to inconsistent information.
Modern businesses need faster access to reliable data.
This is where Power BI transforms the way organizations analyze and monitor performance.
A single dashboard can consolidate information from multiple departments, giving business leaders a complete picture of company performance in one place.
As organizations grow, so does the amount of business data.
Without a centralized reporting solution, companies often experience:
Duplicate reports.
Inconsistent data.
Delayed decision-making.
Manual reporting errors.
Difficulty comparing business performance.
Increased reporting effort.
Business owners and managers spend valuable time collecting information instead of analyzing it.
Replacing multiple reports with one centralized dashboard improves both efficiency and accuracy.
A Power BI dashboard is an interactive visual display that combines important business metrics from multiple data sources into a single screen.
Instead of opening several reports, decision-makers can instantly monitor key performance indicators such as:
Revenue.
Sales performance.
Profit margins.
Customer growth.
Operational efficiency.
Inventory levels.
Employee productivity.
The dashboard updates automatically as new data becomes available, providing a real-time view of business performance.
A retail company operated eight stores across different locations.
Every week, managers submitted separate reports for sales, inventory, customer returns, and expenses.
Senior management spent several hours combining the information before weekly review meetings.
The company introduced a centralized Power BI dashboard that integrated data from all stores.
Immediately, management could monitor:
Daily sales.
Store-wise performance.
Inventory availability.
Product profitability.
Customer purchase trends.
The reporting process became significantly faster, and decision-making improved because everyone worked with the same data.
Microsoft Power BI Business Intelligence connects data from multiple business applications and transforms it into easy-to-understand visual reports.
It supports data integration from:
Microsoft Excel.
ERP systems.
CRM platforms.
SQL databases.
Cloud applications.
Financial software.
Instead of manually preparing reports every week, business owners receive automated dashboards that update continuously.
This allows leadership teams to focus on business decisions rather than report preparation.
An effective Business Performance Dashboard should display only the most important business metrics.
Typical dashboard components include:
Revenue and sales trends.
Gross profit.
Operating expenses.
Customer acquisition.
Inventory status.
Order fulfillment.
Employee productivity.
Business growth trends.
The objective is to present meaningful information clearly without overwhelming users.
A simple dashboard often provides greater value than multiple detailed reports.
A manufacturing company received daily production reports, inventory reports, procurement reports, and quality reports from different departments.
Because each report used different formats, identifying business issues took considerable time.
After implementing Microsoft Power BI Business Intelligence, all departmental information became available within one interactive Business Performance Dashboard.
Management quickly identified production delays, inventory shortages, and supplier performance issues.
As a result:
Production planning improved.
Inventory costs reduced.
Reporting time decreased.
Operational efficiency increased.
The dashboard became the primary source of information for management meetings.
Using a single dashboard provides several business advantages.
Some of the most important benefits include:
Faster business decisions.
Real-time reporting.
Improved data accuracy.
Better collaboration across departments.
Reduced manual reporting effort.
Greater visibility into business performance.
Consistent reporting for leadership teams.
These benefits allow organizations to become more data-driven and responsive.
A national distribution company managed operations across multiple regions.
Every department generated separate weekly reports, making it difficult for executives to identify overall business trends.
The company decided to build a centralized Power BI dashboard using Microsoft Power BI Business Intelligence.
The dashboard combined information from:
Sales.
Finance.
Inventory.
Logistics.
Customer service.
Within a few months, leadership discovered several improvement opportunities:
Underperforming regions.
Delayed deliveries.
Rising transportation costs.
Slow-moving inventory.
By acting on these insights, the company improved operational efficiency, reduced costs, and increased profitability.
One dashboard replaced more than fifteen manual reports.
Organizations often reduce dashboard effectiveness by making avoidable mistakes.
Common mistakes include:
Displaying too many KPIs.
Using inconsistent data sources.
Designing overly complex visuals.
Failing to update data regularly.
Tracking metrics that do not support business goals.
Ignoring user feedback.
A dashboard should simplify decision-making rather than complicate it.
Follow these best practices when designing your dashboard:
Focus on business objectives first.
Select only meaningful KPIs.
Keep visualizations clean and easy to understand.
Use consistent data sources.
Review dashboard performance regularly.
Update reports automatically whenever possible.
Continue learning through the best Power BI courses online.
A well-designed dashboard should answer important business questions within minutes.
If you want to replace multiple business reports with one dashboard, start with these steps:
Identify the reports your business currently uses.
Determine the KPIs that matter most.
Consolidate data from different systems.
Build your first Business Performance Dashboard.
Improve your reporting expertise through the best Power BI courses online.
Even small improvements in reporting can significantly improve business decision-making.
Managing multiple reports can slow decision-making and create unnecessary complexity.
A centralized Power BI dashboard simplifies reporting by bringing all important business information into one place. Combined with Microsoft Power BI Business Intelligence, it helps organizations create an effective Business Performance Dashboard that improves visibility, reduces manual effort, and supports smarter business decisions.
Investing in the best Power BI courses online will help business owners and professionals unlock the full potential of Power BI and transform the way their organizations use data.
Ready to simplify your business reporting?
Enroll in one of the best Power BI courses online and learn how to build a professional Power BI dashboard, create an insightful Business Performance Dashboard, and use Microsoft Power BI Business Intelligence to replace multiple reports with one powerful dashboard that drives better business decisions.
A Power BI dashboard is an interactive report that combines important business metrics into one visual interface, making it easier to monitor company performance.
Microsoft Power BI Business Intelligence connects multiple business systems, automates reporting, and provides real-time insights that support better business decisions.
A Business Performance Dashboard should include revenue, sales trends, expenses, profitability, customer metrics, inventory, and operational KPIs relevant to business goals.
A centralized dashboard improves reporting accuracy, reduces manual effort, speeds up decision-making, and provides a complete view of business performance.
Yes. The best Power BI courses online teach beginners how to connect data, build dashboards, create reports, and use Power BI effectively for business analysis.
https://wa.me/919226022831