
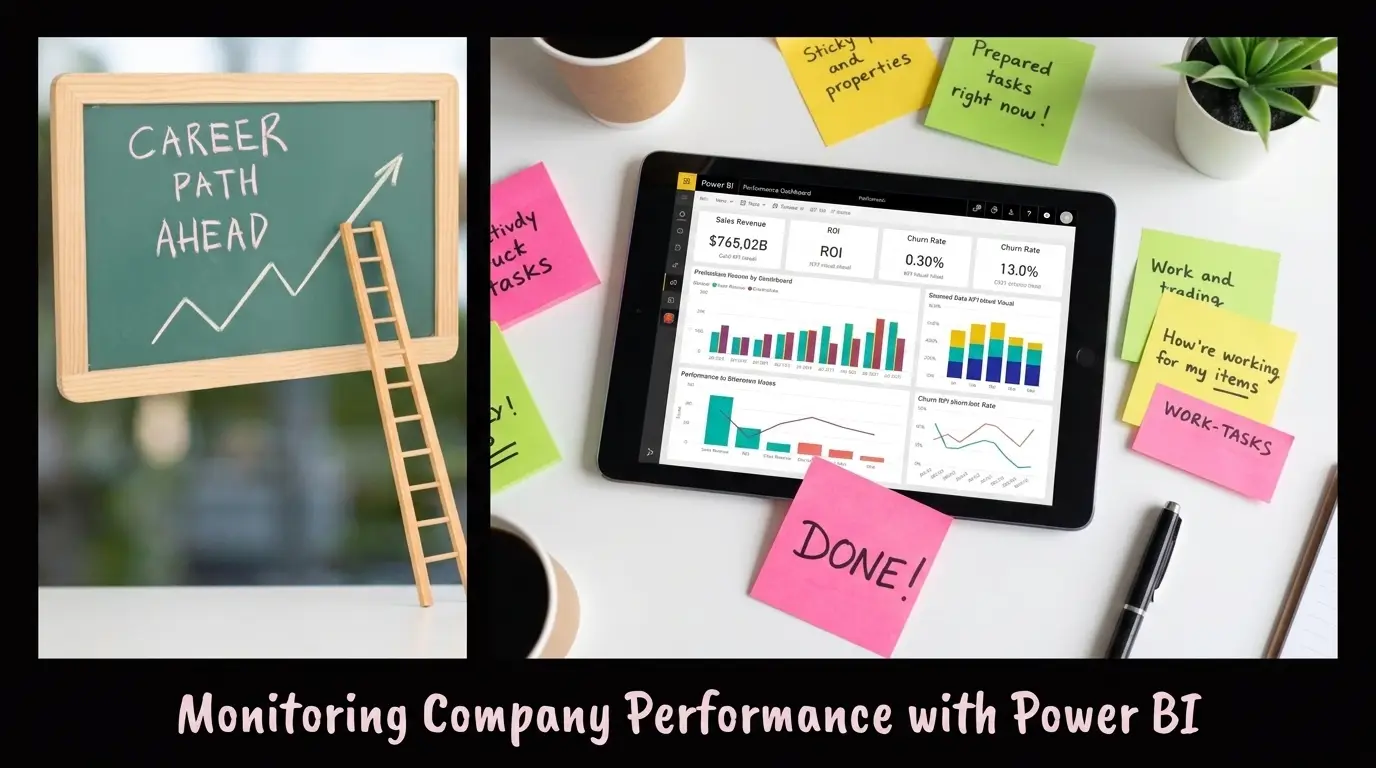

What Is the Best Way to Monitor Business Performance with Power BI?

How Business Owners Can Monitor Company Performance Using Power BI

Power BI dashboard for monitoring business performance

Business owners can make faster and smarter decisions by using a Power BI dashboard to monitor key business metrics in real time. With Microsoft Power BI Business Intelligence, organizations can transform raw data into actionable insights, create an effective Business Performance Dashboard, and improve decision-making. Learning these skills through the best Power BI courses online helps business owners maximize the value of their business data.

Running a successful business requires more than experience and intuition.

Business owners need accurate, real-time information to understand how their company is performing.

Questions such as:

Are sales increasing?

Which products generate the highest revenue?

Are expenses under control?

Which departments are performing well?

Where are business opportunities being missed?

cannot be answered effectively by reviewing spreadsheets alone.

This is where Power BI becomes a valuable business tool.

Power BI converts business data into interactive dashboards that help owners monitor performance, identify trends, and make informed decisions with confidence.

What Is Microsoft Power BI Business Intelligence?

Microsoft Power BI Business Intelligence is a data visualization and analytics platform developed by Microsoft.

It connects data from multiple business systems and transforms it into interactive reports and dashboards that are easy to understand.

Instead of manually reviewing reports from different departments, business owners can monitor all important business information in one place.

Power BI can connect with:

Microsoft Excel

ERP systems

CRM platforms

Accounting software

SQL databases

Cloud applications

This provides a complete view of business performance.

Why Every Business Needs a Power BI Dashboard

A well-designed Power BI dashboard allows business owners to monitor critical business metrics without spending hours analyzing spreadsheets.

Some key benefits include:

Real-time business insights.

Faster decision-making.

Improved operational visibility.

Better financial monitoring.

Easier performance tracking.

Interactive reports and visualizations.

Rather than reacting to problems after they occur, business owners can identify issues early and take corrective action.

Real-Life Example: Retail Business Owner

A retail business owner managed five stores across different cities.

Each store submitted separate Excel reports every week, making it difficult to compare performance.

After implementing a Power BI dashboard, the owner could monitor:

Daily sales.

Store performance.

Product profitability.

Inventory levels.

Customer trends.

Within a few months:

Slow-moving products were identified quickly.

Inventory planning improved.

Sales performance increased.

Business decisions became data-driven.

The owner no longer relied on multiple spreadsheets to understand business performance.

What Should a Business Performance Dashboard Include?

An effective Business Performance Dashboard should provide a clear overview of the company’s most important metrics.

Common dashboard components include:

Total revenue.

Monthly sales trends.

Profit margins.

Operating expenses.

Customer growth.

Inventory status.

Employee productivity.

Regional performance.

By displaying these metrics in one place, business owners gain a comprehensive understanding of business health.

How Microsoft Power BI Business Intelligence Supports Better Decisions

Business decisions are most effective when supported by reliable data.

Microsoft Power BI Business Intelligence enables business owners to:

Compare current and historical performance.

Identify sales trends.

Monitor departmental performance.

Forecast future growth.

Detect operational inefficiencies.

Track business goals.

Instead of relying on assumptions, leaders can make decisions based on measurable insights.

Real-Life Example: Manufacturing Company

A manufacturing company experienced declining profitability despite increasing sales.

Using a Business Performance Dashboard, management discovered that production costs had increased significantly due to supplier pricing changes.

Because the issue was identified early, the company renegotiated supplier contracts and improved production planning.

As a result:

Profit margins improved.

Production costs reduced.

Operational efficiency increased.

Without the dashboard, the issue may have remained unnoticed for several months.

Why Business Owners Should Learn Power BI

Many business owners rely entirely on technical teams to prepare reports.

However, understanding the basics of Power BI allows leaders to interpret data more effectively and ask better business questions.

The best Power BI courses online teach practical skills such as:

Connecting business data.

Creating dashboards.

Building interactive reports.

Using data visualizations.

Monitoring business KPIs.

Making data-driven decisions.

Learning these skills helps business owners become more independent and informed decision-makers.

Case Study: Improving Business Performance Through Data

A growing distribution company wanted to improve operational efficiency across multiple branches.

The leadership team implemented Microsoft Power BI Business Intelligence to consolidate sales, inventory, finance, and customer data.

The new Power BI dashboard highlighted several issues:

Inventory shortages in high-performing regions.

Slow-moving products occupying warehouse space.

Rising transportation costs.

Uneven sales performance across branches.

Using these insights, management adjusted inventory planning, optimized logistics, and focused additional sales efforts on underperforming regions.

Within six months:

Revenue increased.

Inventory costs reduced.

Customer service improved.

Overall business performance became more predictable.

The dashboard became an essential part of weekly management meetings.

Common Mistakes Business Owners Make

Many organizations fail to maximize the value of business data.

Common mistakes include:

Depending entirely on spreadsheets.

Reviewing reports only at month-end.

Tracking too many KPIs.

Ignoring data quality.

Creating overly complex dashboards.

Making decisions without reliable data.

Avoiding these mistakes improves both reporting accuracy and business performance.

Best Practices for Building an Effective Power BI Dashboard

To create a useful Power BI dashboard, follow these best practices:

Focus on the most important business KPIs.

Keep dashboard layouts simple and easy to understand.

Use visualizations that support quick decision-making.

Update data regularly.

Review dashboards consistently with leadership teams.

Continuously improve reporting based on business needs.

Learn advanced reporting techniques through the best Power BI courses online.

A simple dashboard that answers key business questions is often more valuable than a complex report filled with unnecessary information.

Quick Action Plan

If you want to improve business performance using Power BI, start with these steps:

Identify the KPIs that matter most to your business.

Gather data from your existing systems.

Create your first Business Performance Dashboard.

Review performance every week.

Continue improving your reporting skills through the best Power BI courses online.

Small improvements in reporting often lead to significant improvements in business decision-making.

Conclusion

Successful businesses rely on accurate information, not assumptions.

By implementing a Power BI dashboard, using Microsoft Power BI Business Intelligence, and creating a comprehensive Business Performance Dashboard, business owners gain greater visibility into every aspect of their operations.

Investing in the best Power BI courses online further strengthens your ability to analyze business data, improve operational efficiency, and make smarter strategic decisions that support long-term growth.

Call To Action

Ready to make smarter business decisions with data?

Enroll in one of the best Power BI courses online and learn how to build a professional Power BI dashboard, create an insightful Business Performance Dashboard, and use Microsoft Power BI Business Intelligence to monitor company performance, improve decision-making, and accelerate business growth.

FAQs

A Power BI dashboard is an interactive visual report that displays important business metrics, helping organizations monitor performance and make informed decisions.

Microsoft Power BI Business Intelligence is Microsoft's analytics platform that converts business data into meaningful dashboards and reports for better decision-making.

A Business Performance Dashboard should include key metrics such as sales, revenue, expenses, profitability, customer growth, inventory, and operational performance.

Learning Power BI helps business owners understand business data, monitor performance independently, and make faster, data-driven decisions. The best Power BI courses online provide practical skills for building dashboards and analyzing business information.

Yes. Businesses of all sizes can use Power BI to improve reporting, monitor KPIs, identify trends, and make more informed business decisions.

Adaptability skills for the AI-driven workplace
Human Skills That Matter Most in the AI Era
Human Skills That Matter Most in the AI Era As Artificial Intelligence transforms the workplace, human abilities are becoming more important, not less. Critical thinking, communication, creativity...

Soft skills training for student career development
Why Students Need Soft Skills Training
Why Students Need Soft Skills Training Academic knowledge can help students qualify for opportunities, but soft skills for students help them succeed in interviews, internships, college projects...

LinkedIn content strategy for creating engaging posts
How to Write Viral LinkedIn Posts That Generate Engagement
How to Write Viral LinkedIn Posts That Generate Engagement Viral LinkedIn posts combine a strong opening, valuable insights, authentic experiences, and content that encourages conversation. A consistent...
Power BI dashboard for monitoring business performance
How Business Owners Can Monitor Company Performance Using Power BI
How Business Owners Can Monitor Company Performance Using Power BI Business owners can make faster and smarter decisions by using a Power BI dashboard to monitor key...

Improve communication skills daily
10 Daily Habits to Build Self-Confidence in Communication
10 Daily Habits to Build Self-Confidence in Communication Building communication confidence starts with small daily habits rather than overnight transformation. If you want to improve communication skills...
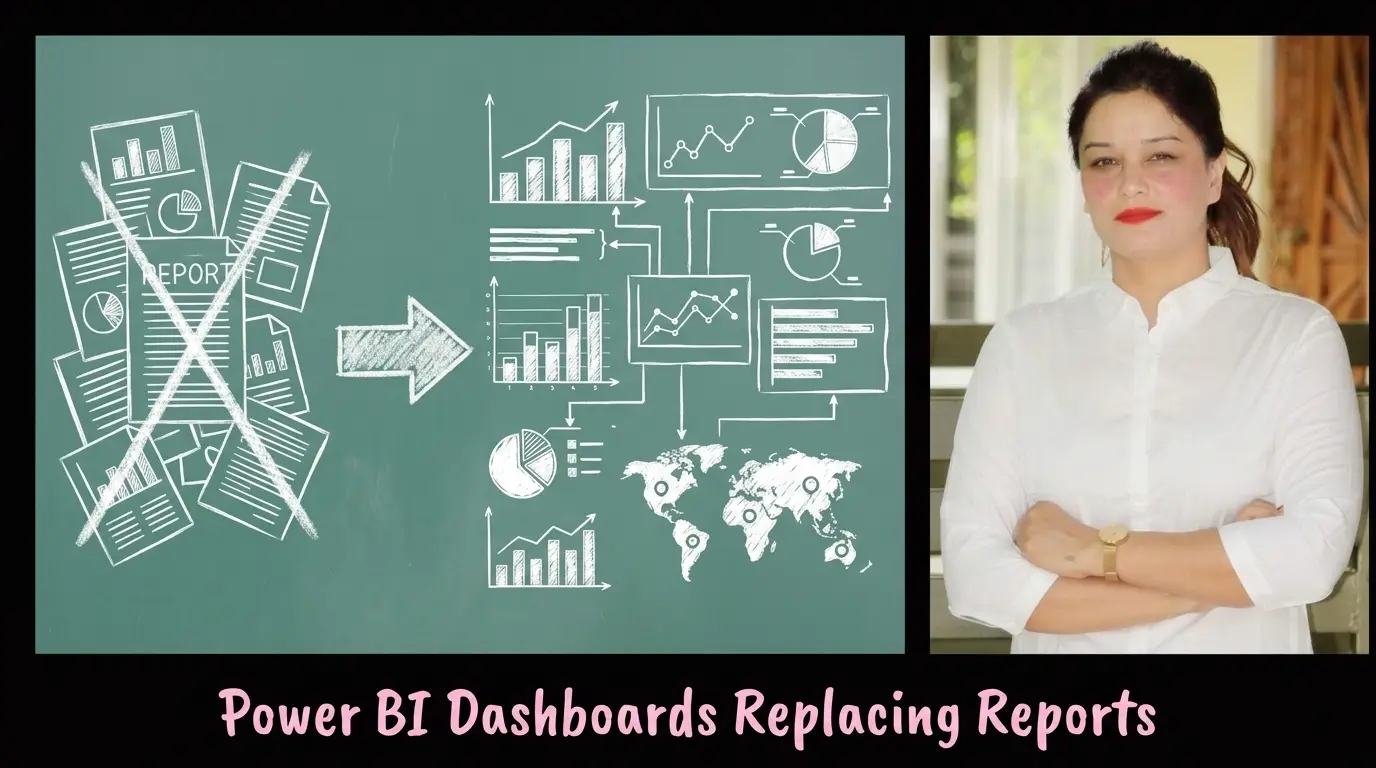
Business Performance Dashboard in Power BI
How One Dashboard Can Replace Multiple Business Reports Using Power BI
How One Dashboard Can Replace Multiple Business Reports Using Power BI A single Power BI dashboard can replace multiple spreadsheets and reports by bringing all critical business...